

By Canterbury Investment Management
Market State 6 (Transitional) – The Market Environment (which is based on the S&P 500) remains in a transitional Market State 6 as indicated by Canterbury’s algorithms. This Transitional state was caused by a spike in volatility (CVI) on August 5th.
In the 9 trading days since August 5th, 6 of those days have been greater than +/- 1%. In the 33 trading days prior to August 5th, which were days spent in a Bullish Market State, there was only 1 day beyond +/-1%. Transitional Markets are sometimes like a box of chocolates- you never know what you’re going to get.
Canterbury weekly video update: https://youtu.be/SBDM2mqSqL4
Other Markets:
| Dow Jones | Market State 6- Transitional |
| Nasdaq | Market State 6- Transitional |
| Russell 2000 | Market State 12- Bearish |
| EAFE | Market State 6- Transitional |
| Emerging Markets | Market State 12-Bearish |
| Dollar | Market State 1- Bullish |
| Treasury Bonds | Market State 1- Bullish |
| Gold | Market State 1-Bullish |
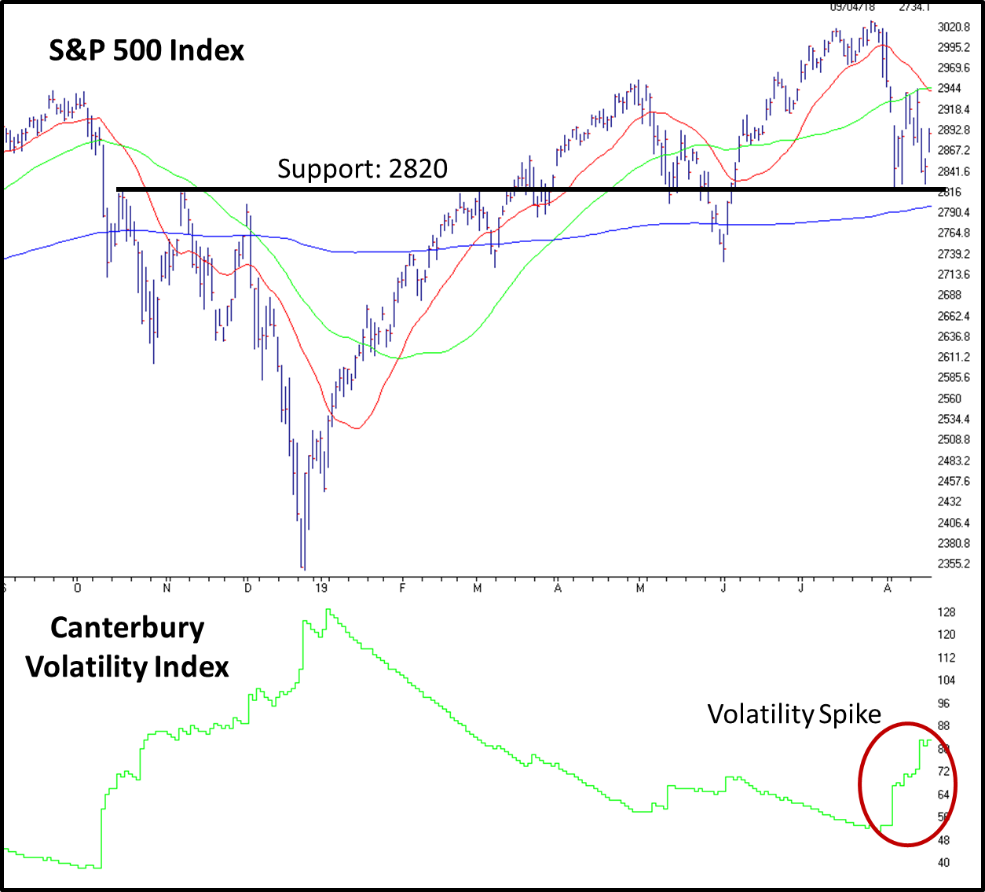
Canterbury Volatility Index (CVI)- CVI 83- The current volatility reading for the S&P 500 measures CVI 83. Volatility was as low as CVI 51 in late July before spiking on August 5th into the current transitional Market State. We have seen a few outlier days during the last few weeks, causing volatility to continue rising as the market attempts to find its footing.
Other Equity Markets:
| Dow Jones | CVI 81 (increasing) |
| Nasdaq | CVI 102 (increasing) |
| Russell 2000 | CVI 98 (increasing) |
| EAFE | CVI 72 (increasing) |
| Emerging Markets | CVI 94 (increasing) |
| Dollar | CVI 23 (Flat) |
| Treasury Bonds | CVI 68 (increasing) |
| Gold | CVI 73 (started decreasing) |
Market Comment
It looks like the market (S&P 500) may have found a little support following the spike in volatility (CVI) on August 5th. This support appears to be around the 2820 level. You can see that back in October/November of 2018, the S&P had fallen below this level, and then rallied to back to it on 3 different occasions, failing to break through each time (making the 2820 level resistance). It then tested this level again in back March/April, before pulling back and then breaking through. Following the recent volatility spike, the S&P 500 has reached the 2820 level three times in a very short time frame, with each time bouncing off of it. So, for the short-term, 2820 appears to be support.
The Russell 3000 Index (US small caps), on the other hand, has found resistance where large caps found support. You can see in the chart below that back in October/November, the Russell 3000 found resistance at the 1600 level. Since then, it has tested this level multiple times (most recently at the end of July) and failed to break through each and every time. During the recent Transitional market, it has begun putting in a series of lower lows.

Portfolio Metrics
The Canterbury Portfolio Thermostat does not aim to compete against any individual index or blended benchmark. We know that portfolio efficiency is a moving target, and all asset classes will go in and out of favor. The Portfolio Thermostat is an Adaptive Portfolio Strategy designed to navigate various markets and create an efficient portfolio for today’s environment- Bull or Bear.
Canterbury benchmarks its portfolio against key “internal” metrics, in order to measure portfolio efficiency. These metrics are Portfolio State, Portfolio Volatility, and Portfolio Benefit of Diversification. Together, these internal benchmarks create the Portfolio Efficiency Score. Below, you will find a description and reading of each metric.
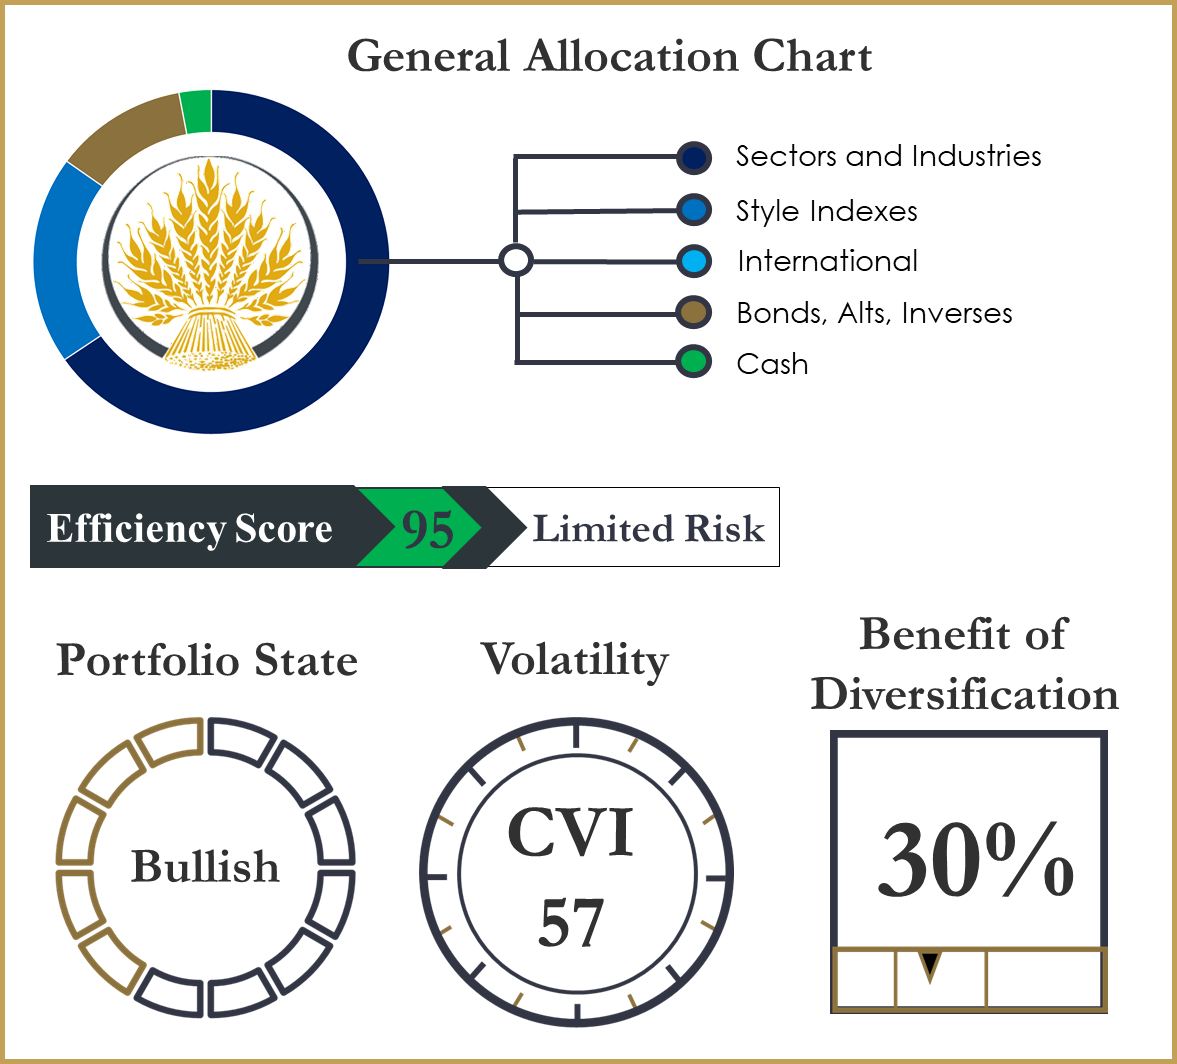
Efficiency Score:
Today’s Portfolio Efficiency Score of 95 indicates that the portfolio is efficient for the current market environment. A Portfolio Efficiency Score between 70-100 is deemed efficient; 60-69 is transitional; 0-59 is inefficient. The portfolio currently shows low risk characteristics and is properly diversified among securities to create a portfolio that is in a “bullish” portfolio state for today’s environment. The Portfolio Thermostat will continue to adapt as the markets navigate through this transitional environment.
Portfolio State- The current combinations of securities held creates a bullish, low risk portfolio for the current market environment.
Volatility- CVI 57- The volatility of the portfolio is currently within the desired range. Volatility has risen slightly, but remains low and stable.
Benefit of Diversification- 30%. The current B.of.D, which is a measure of a portfolio’s diversification level, is currently in the desired range. In a bullish/transitional market environment, the B.of.D should be between 25-35%. In a more volatile transitional or bearish environment, the Benefit of Diversification should be higher than that.
Canterbury Research
Below are the current risk-adjusted relative strength readings for the style indexes and S&P Sectors. These risk-adjusted rankings are according to Canterbury’s Volatility-Weighted-Relative-Strength (VWRS).
![]()
Bottom Line
The key to long-term investment success is to make solid short-term investment decisions. All liquid assets/securities will have both bull and bear markets, as well as periods of underperformance and outperformance. As shown in the charts in the “Market Comment” section, large caps have outperformed small caps by a wide margin. Where large caps have found support, small caps are still seeing resistance and have not been able to break through these levels.
As for the Transitional market, the market needs to find its footing and figure out where it wants to be. If we examine the S&P sectors, some more “defensive” sectors like utilities and consumer staples are currently showing leadership.
If we want to focus on the long-term investment, our short-term decision making is crucial. That is why it is important to keep our focus on key internal metrics within our portfolio. If a portfolio can maintain efficiency, or in other words maintain consistent, low volatility and proper diversification levels, then we know that over the long-term, the portfolio will have the ability to compound and limit drawdowns.
This article was submitted by Canterbury Investment Management, a participant in the ETF Strategist Channel.