The S&P 500 continuously gaps up and sells off during the day. Meanwhile, the Nasdaq 100 has made a new all-time high.
Let’s determine the stock market’s most probable medium-term direction by objectively quantifying technical analysis. For reference, here’s the random probability of the U.S. stock market going up on any given day.

*Probability ≠ certainty. Past performance ≠ future performance. But if you don’t use the past as a guide, you are blindly “guessing” the future.
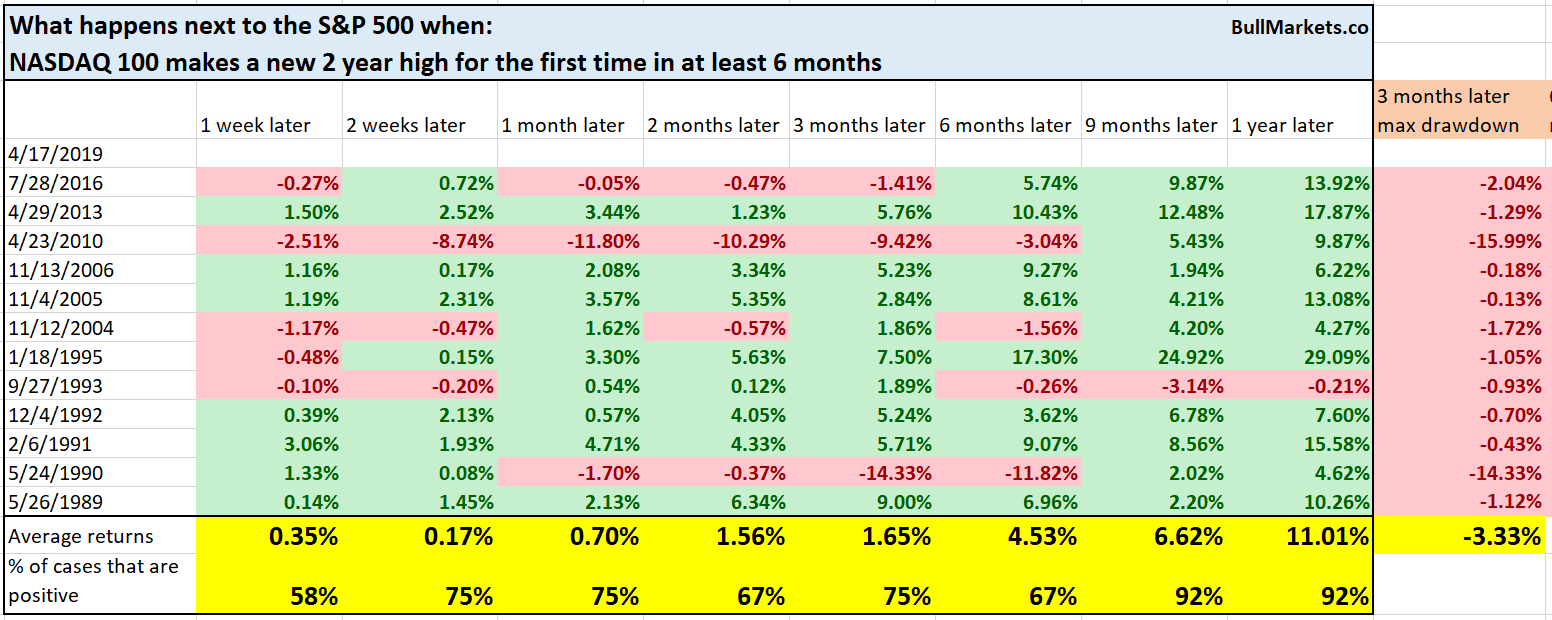
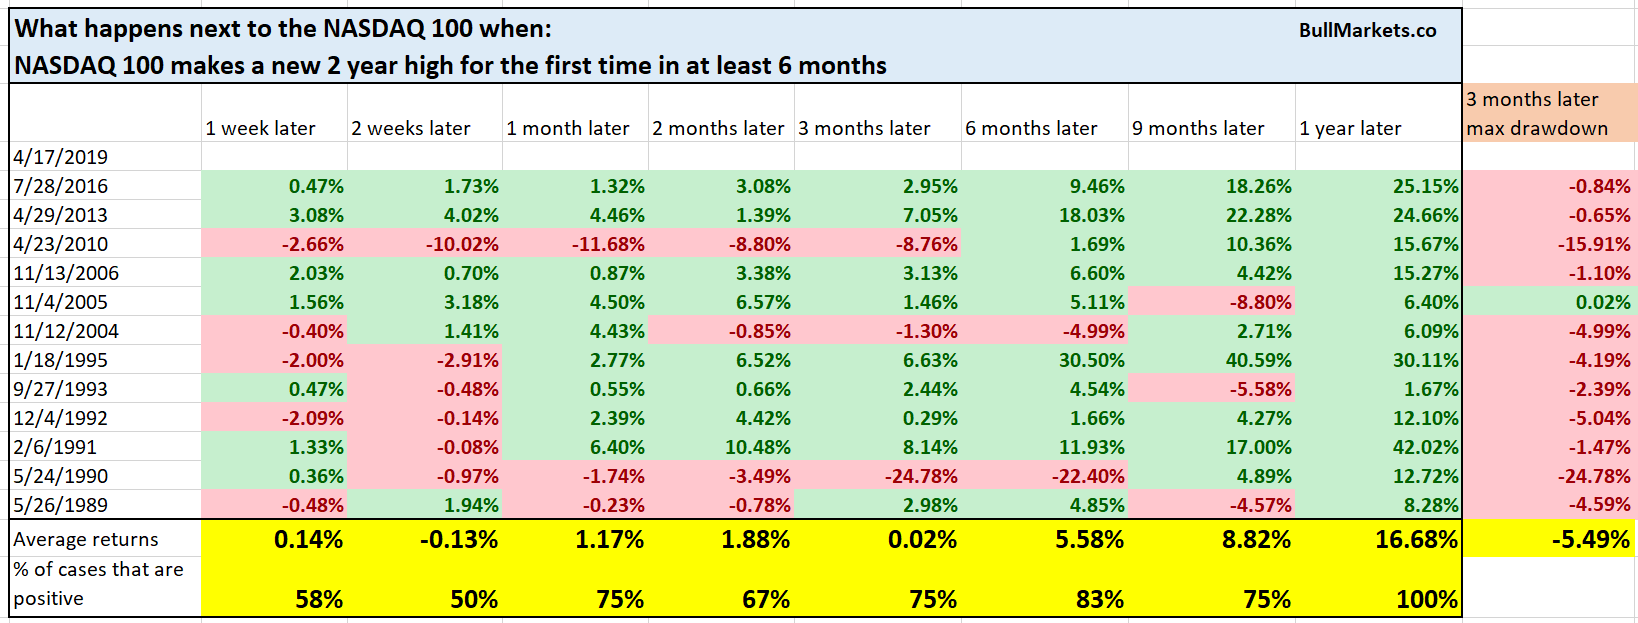
NASDAQ 100 new high
The NASDAQ 100 (tech) has made a new all-time high for the first time in more than 6 months.

Historically, the S&P’s and NASDAQ’s forward returns upon doing so were mostly bullish 1 year later.
*Data from 1985 – present
Outside reversal day
The S&P 500 “looks like” it made an outside reversal day.
An outside reversal day is when today’s HIGH exceeds yesterday’s HIGH, and today’s LOW exceeds yesterday’s low.
Why is it seen as a reversal pattern?
Textbook technical analysis logic: “buyers don’t have enough strength to sustain the market during the day when trading volume is heavier than at night”

- The magnitude of this reversal is quite rare. Not only did today’s HIGH and LOW exceed yesterday’s HIGH and LOW, it exceeded the HIGHs and LOWs of the previous 3 days.
- Moreover, each of the past 3 days saw the S&P selloff from the OPEN to CLOSE.
Must be a bearish sign, right? Surely this means that “buyers can’t sustain momentum?”
Here’s the actual data.
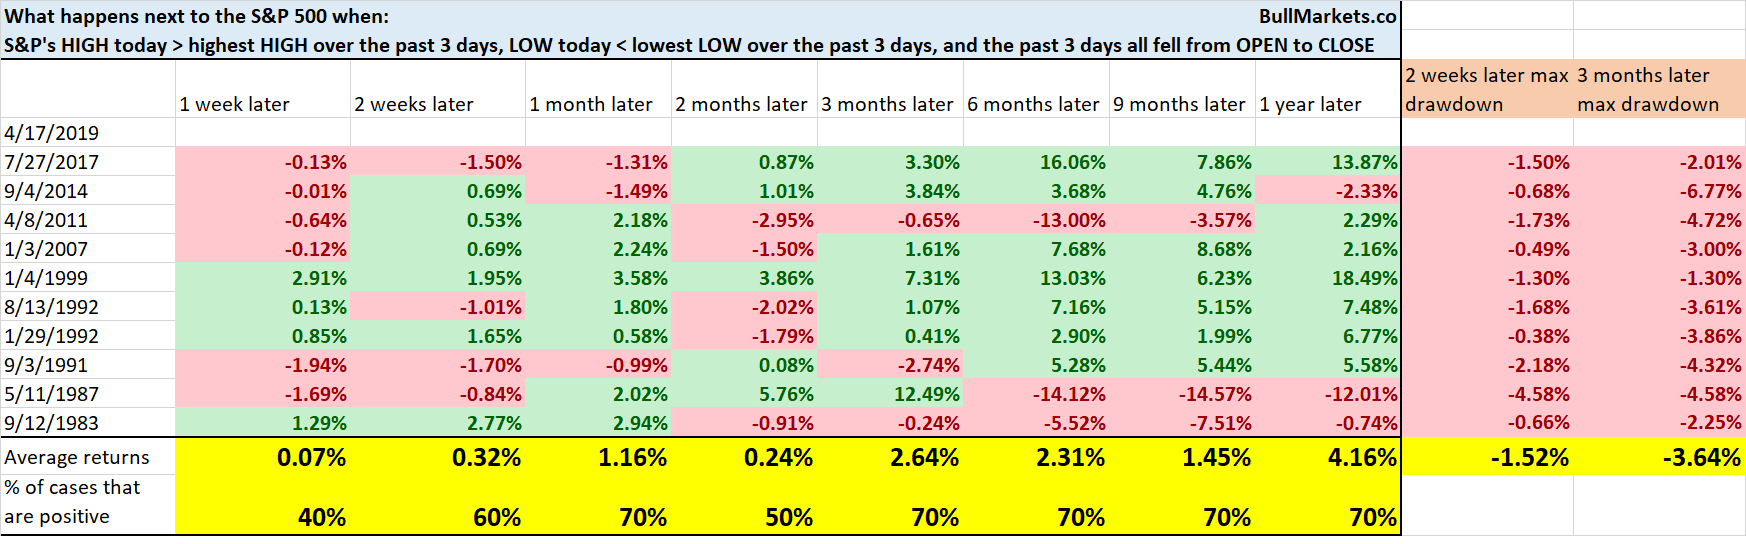
Somewhat short-term bearish.
A real weak point
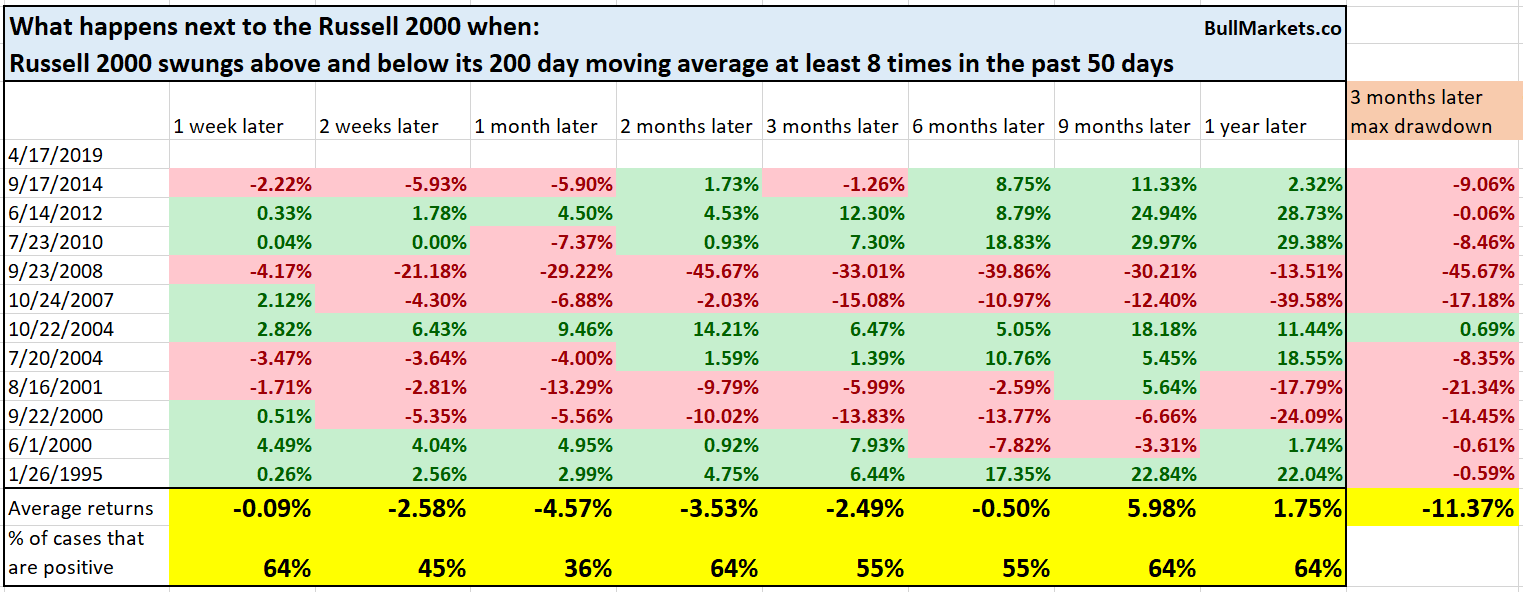
Small caps continue to lag significantly. While the S&P, NASDAQ, and Dow all push higher, the Russell 2000 (small caps) remains indecisive around its 200-day moving average. The Russell 2000 fell below its 200 DMA again today.

Here’s what happens next to the Russell when it swung above and below its 200 DMA at least 8 times in the past 50 days.
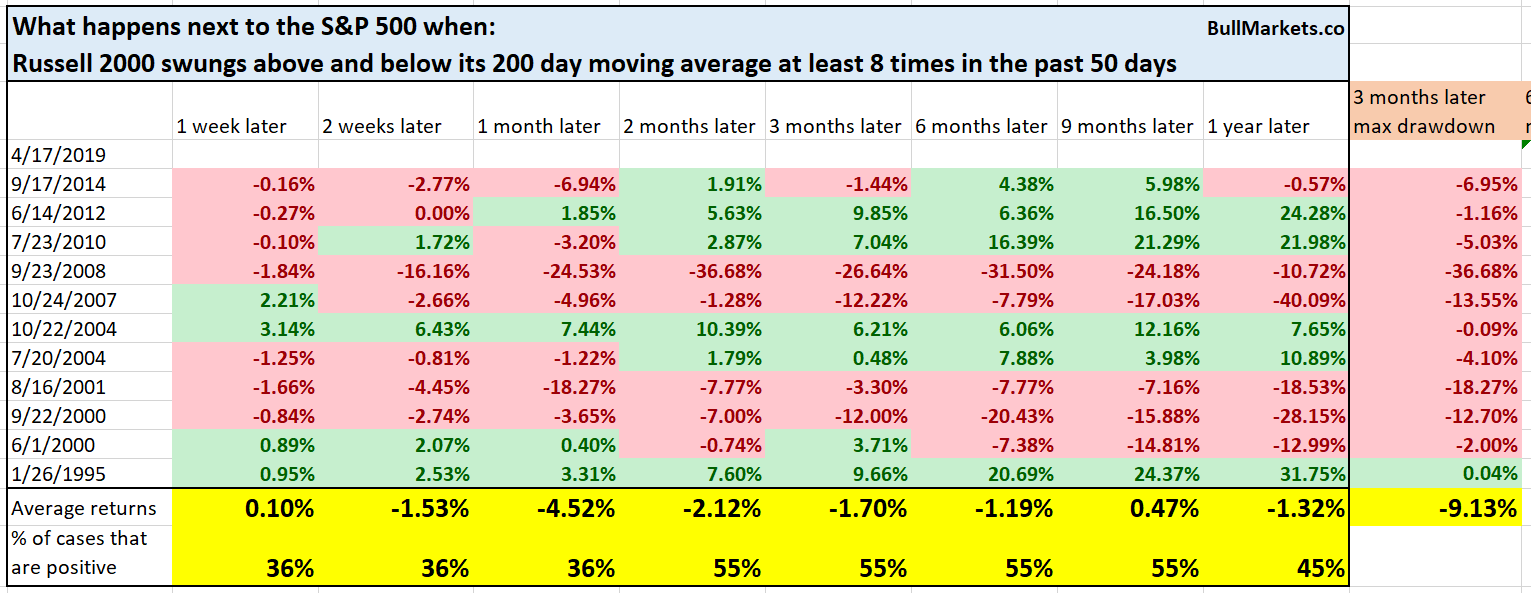
Here’s what happens next to the S&P
Short term bearish signs.
It’s 2008/2009 all over again
XLV (healthcare) has significantly underperformed the S&P in the past 2 days. In fact, XLV has underperformed the S&P by the most since 2008 (cue the scary music).

Before you panic from recency bias, please consider what has caused XLV’s underperformance. From CNN:
The sector-wide slump came after UnitedHealth (NYSE:UNH) CEO David Wichmann said “Medicare for All” policies, as proposed by some politicians and presumed candidates for the 2020 presidential election, would hurt the industry.
So this is more of an industry-specific issue than a systematic problem.
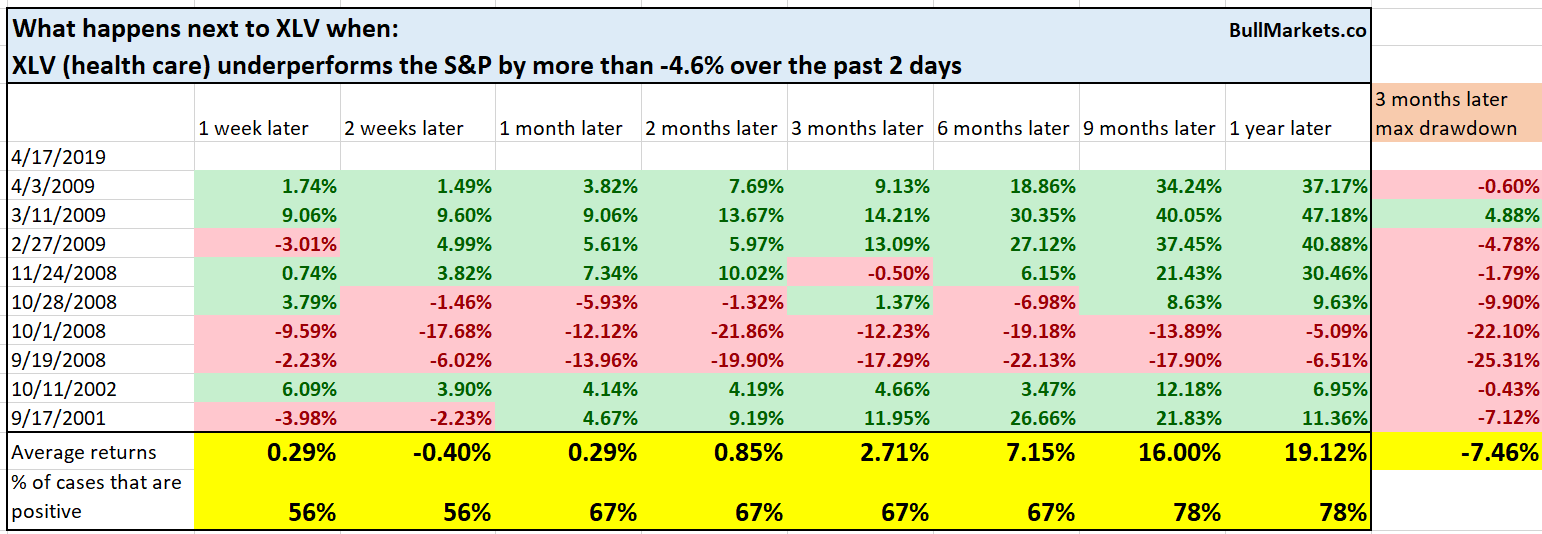
Here’s what happens next to the S&P and XLV when XLV underperforms the S&P by more than -4.6% over the past 2 days.
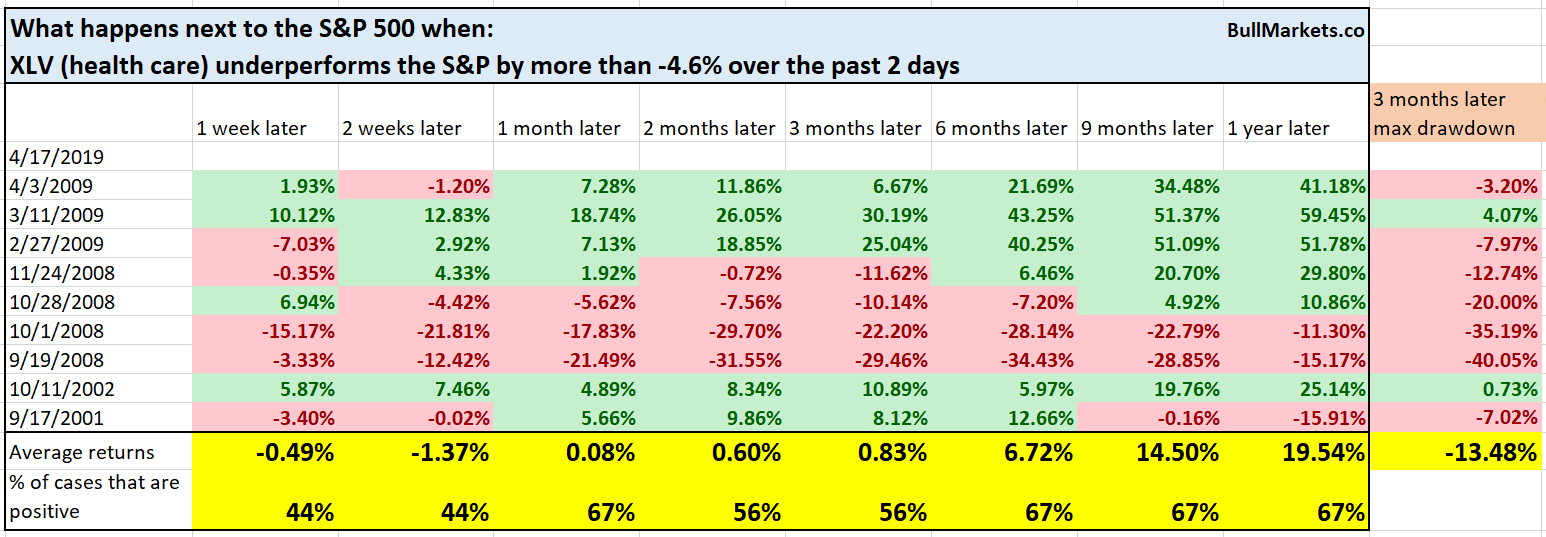
Why did all the historical cases occur during bear markets (2000-2002, 2007-2009)?
Because bear markets are extremely volatile. It is very easy for the market to go up and down 5% in a day, which means that many sectors will diverge significantly from each other on a multi-day basis.
Currency Volatility
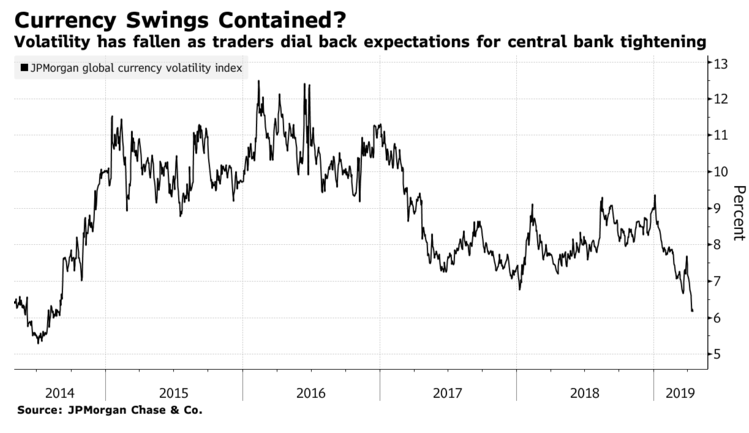
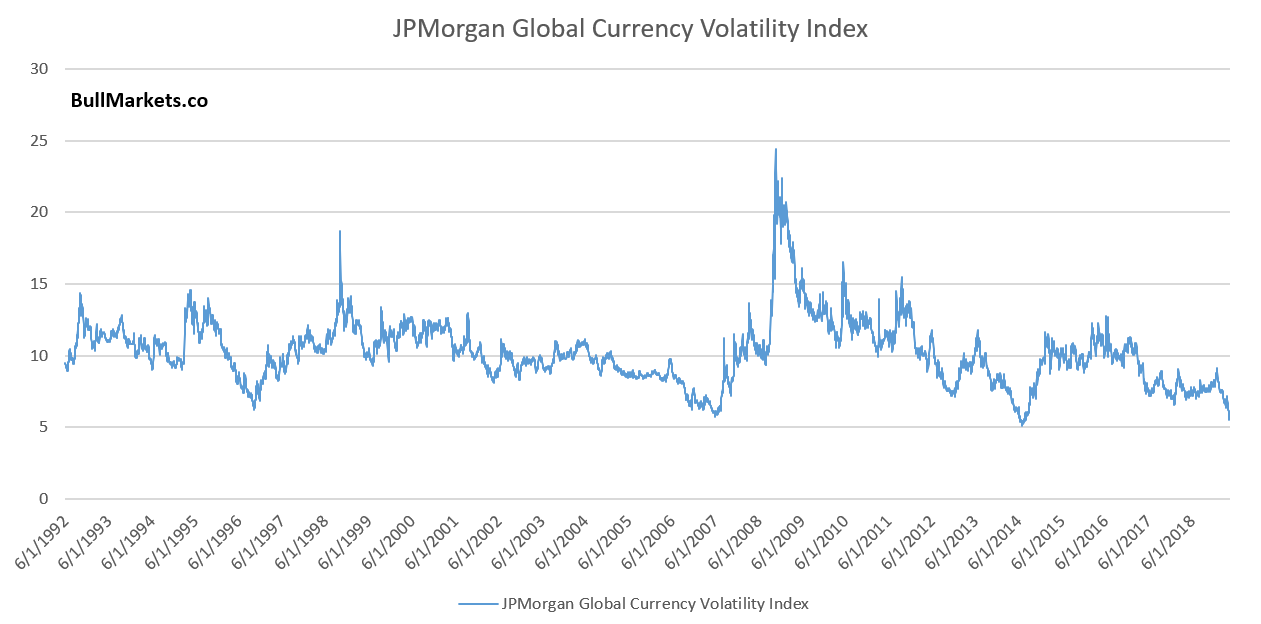
Let’s look at the JPMorgan (NYSE:JPM) Global Currency Volatility Index more closely.
As you can see, currency volatility is very low right now. Here’s what happens next to the USD Index when the JPMorgan Global Currency Volatility Index is at a multi-year low.
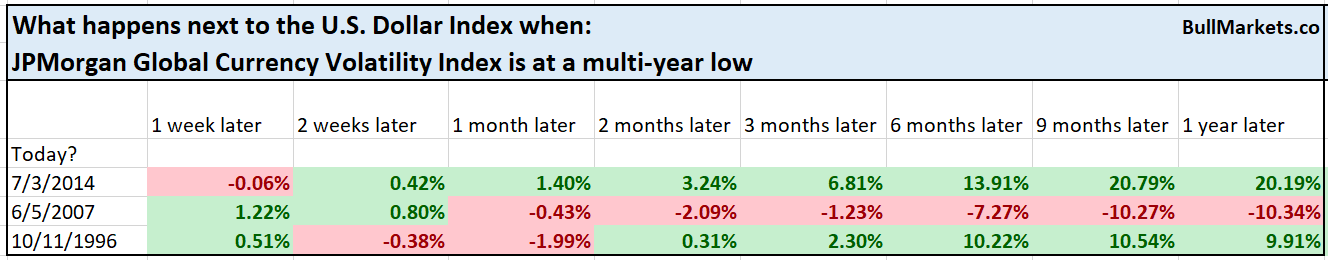
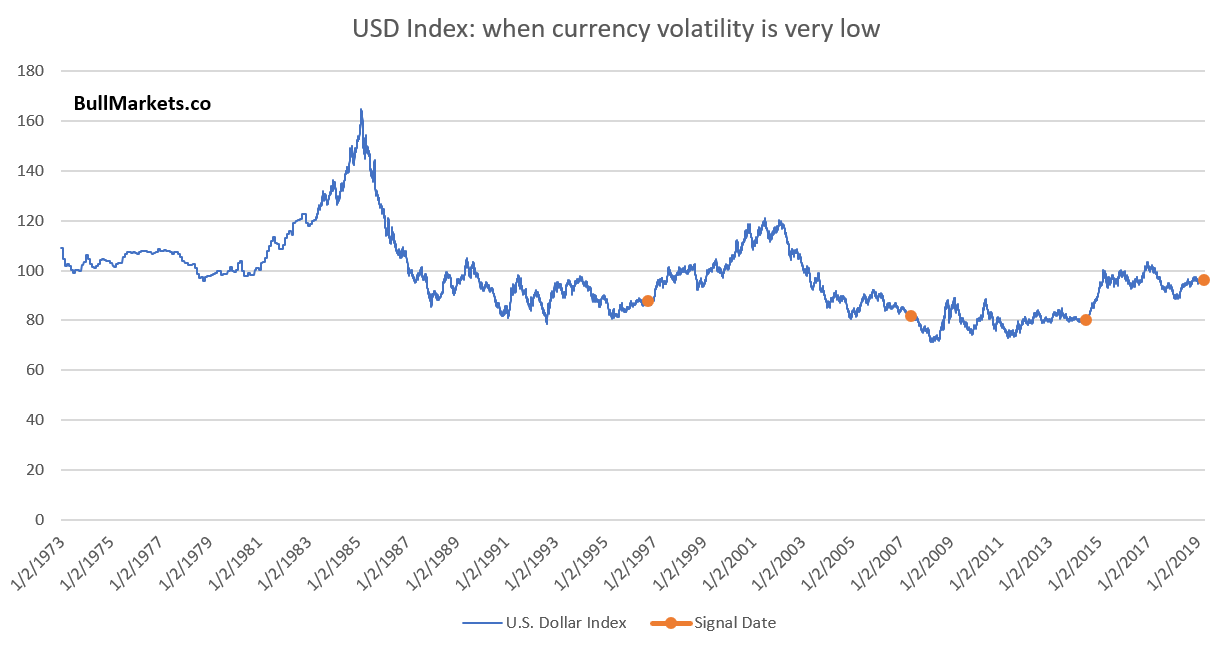
Herein lies the problem: you only know that currency volatility is at a multi-year low with 20/20 hindsight. In real time, you have no idea if volatility will go even lower.
Here’s a more objective, real-time study. Here’s what happens next to the USD Index when the JPMorgan Global Currency Volatility Index is more than -25% below its 200 dma.
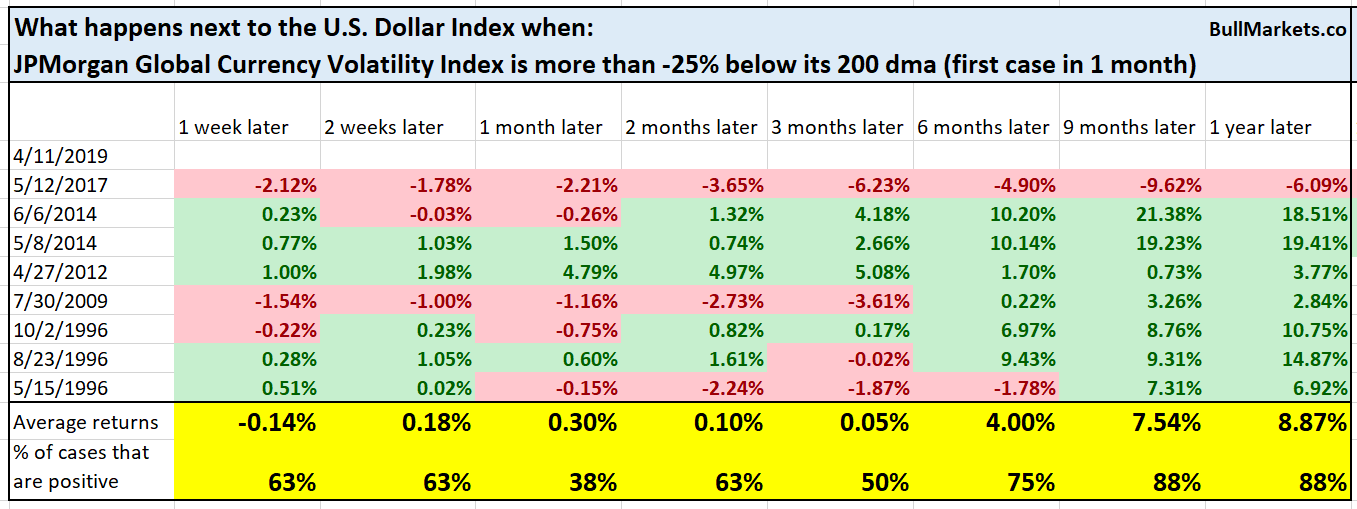
Quite bullish 9-12 months later.
Here’s what happens next to the S&P
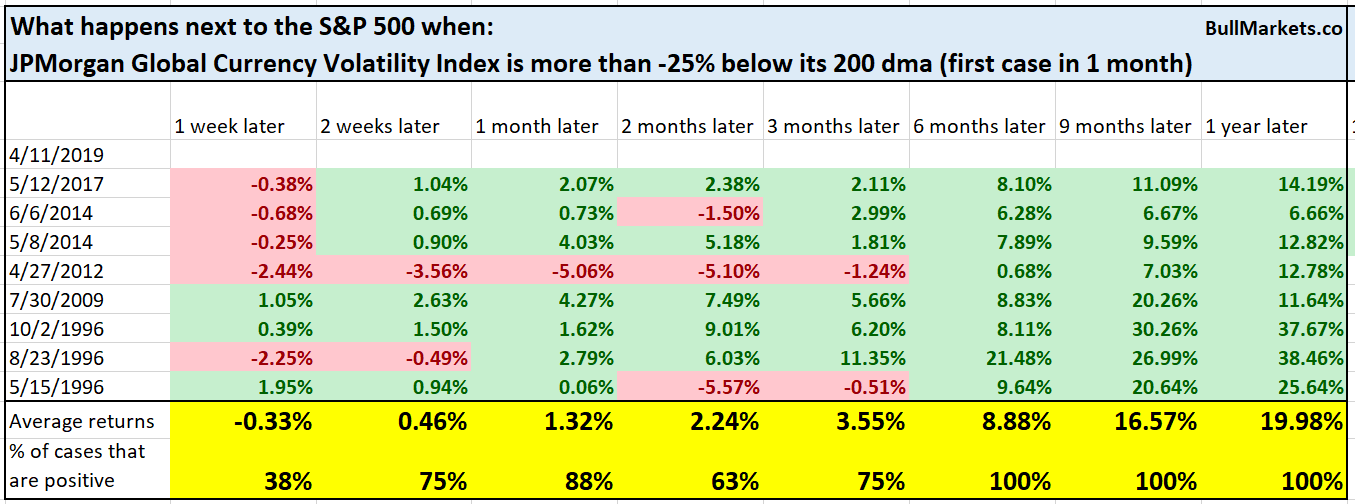
Contrary to popular belief, a rising USD isn’t a consistent drag on the S&P.
Low volatility index
The S&P 500 Low Volatility Index is on fire, making new highs before the S&P and NASDAQ.
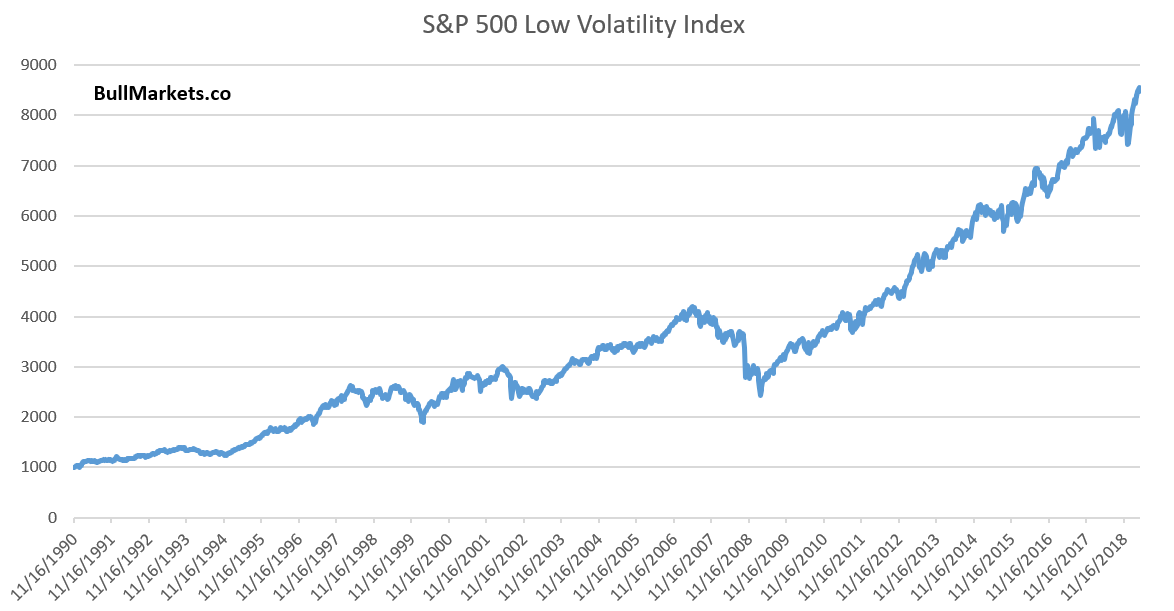
As a result, the S&P 500 Low Volatility Index is quite overbought. Its 14 weekly RSI now exceeds 68.
Here’s what happens next to the S&P Low Volatility Index when its weekly RSI is this high.
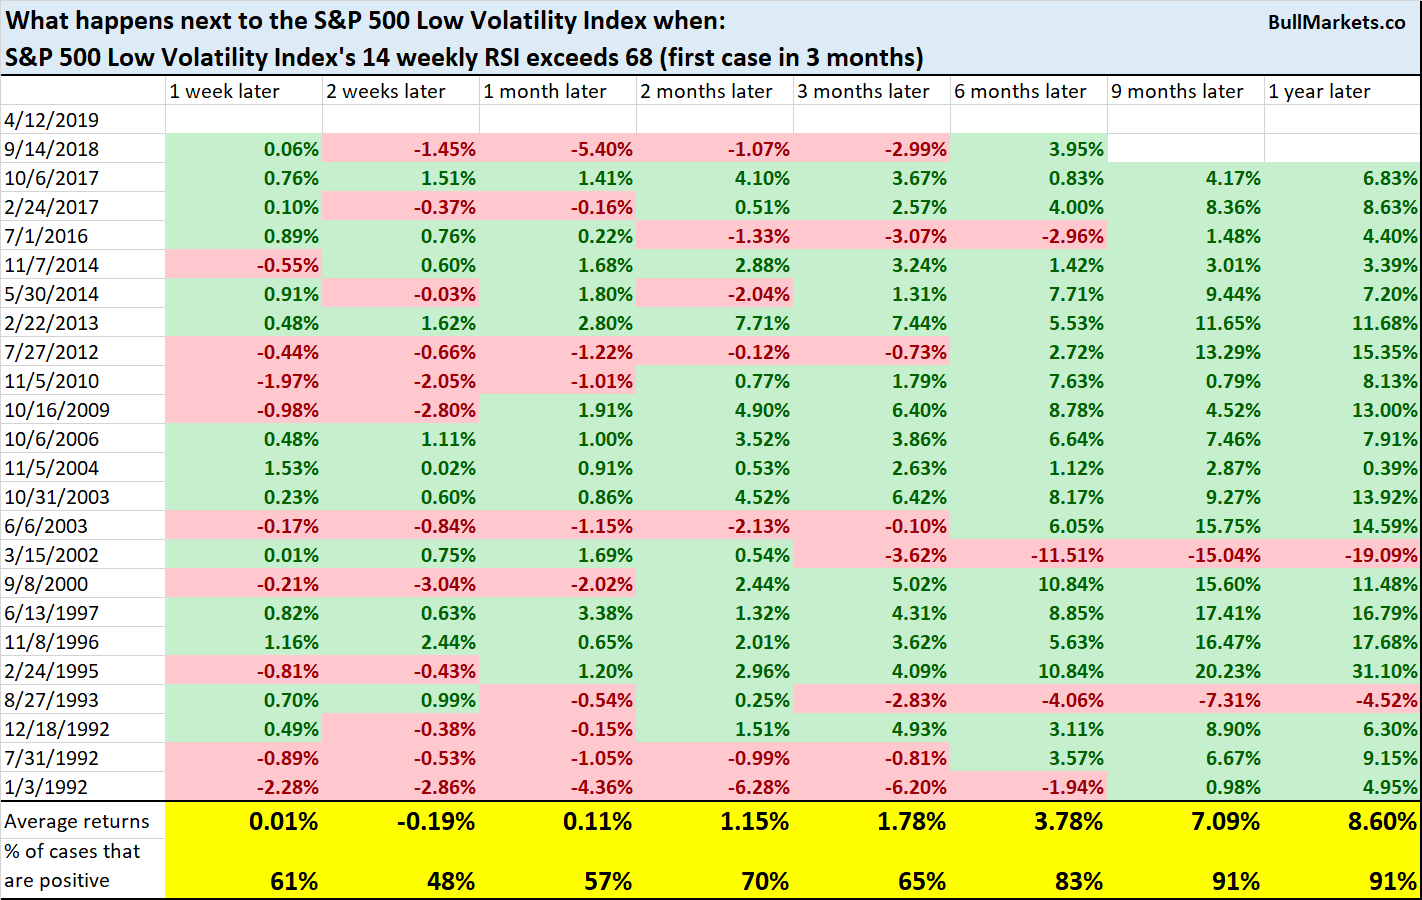
The S&P Low Volatility Index (which moves closely with the S&P) has a slight short term bearish lean.
One more thing…
And lastly, here’s the most curve fitted, data mined trading model of all time.
This is what happens when you only buy the S&P during the first 5 and last 2 trading days of each month.
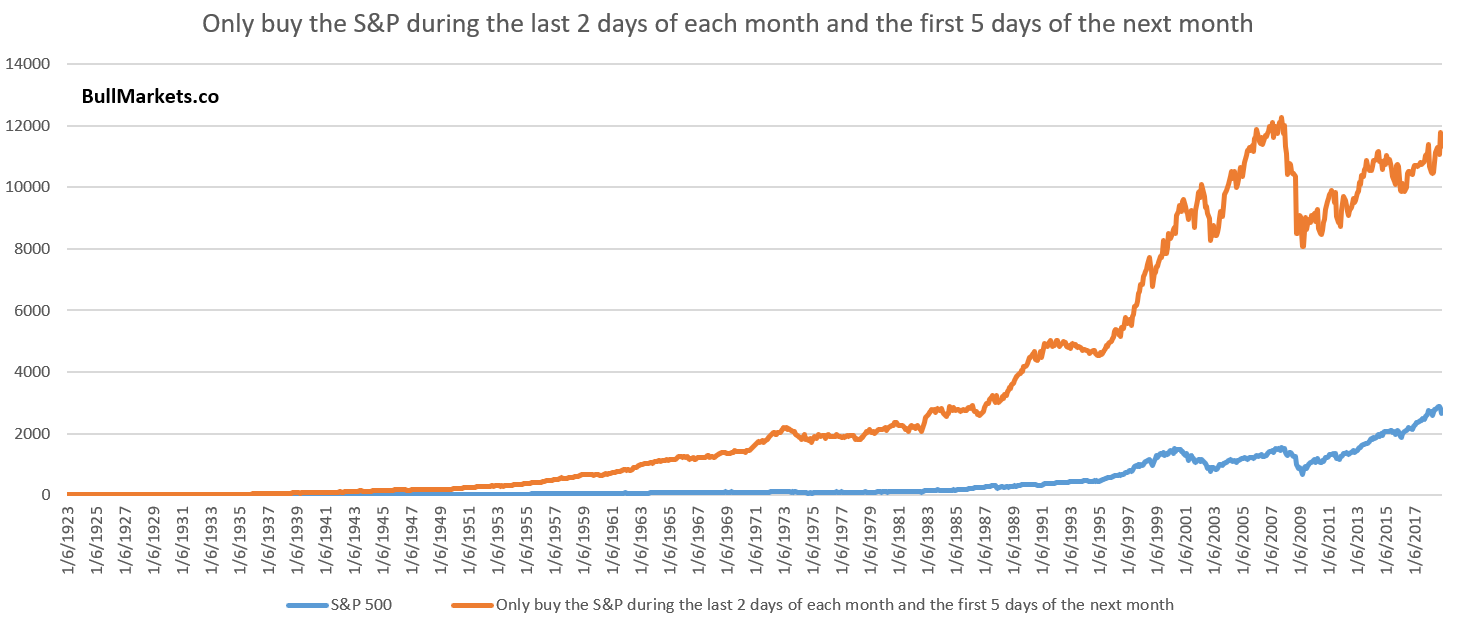
As you can see, this model beats buy and hold. Would I use this?
No.
- Data mined
- There’s no fundamental reason as to why this should outperform
- This curve fitted strategy has gone nowhere since 2008
Conclusion
Here is our discretionary market outlook:
- The U.S. stock market’s long term risk:reward is no longer bullish. In a most optimistic scenario, the bull market probably has 1 year left. Long term risk:reward is more important than trying to predict exact tops and bottoms.
- The medium term direction (e.g. next 6-9 months) is mostly mixed, although there is a bullish lean.
- We don’t predict the short term because the short term is always extremely random. At the moment, the short term does seem to have a slight bearish lean.
- In summary, 12-24 months = bearish, 12 months = neutral, 6-9 months = slightly bullish.
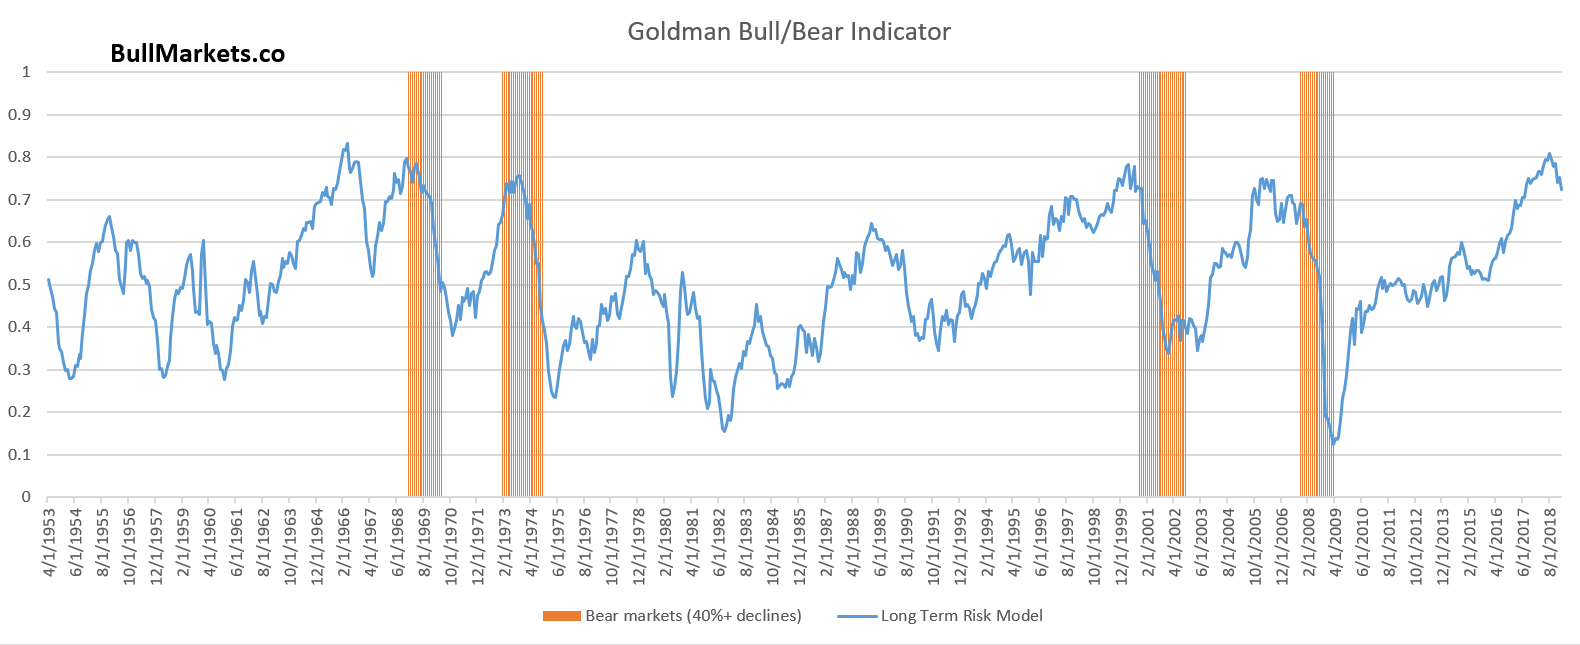
Goldman Sachs’ Bull/Bear Indicator demonstrates that risk:reward does favor long term bears.